![]()
![]()

To create maps from tiles, maptiles downloads, composes
and displays tiles from a large number of providers (e.g. OpenStreetMap,
Stadia, Esri, CARTO, or Thunderforest).
You can install the released version of maptiles from CRAN with:
install.packages("maptiles")You can install the development version of maptiles from
GitHub with:
# install.packages("remotes")
remotes::install_github("riatelab/maptiles")This is a basic example which shows you how to dowload and display OpenStreetMap tiles over North Carolina:
library(sf)
#> Linking to GEOS 3.13.1, GDAL 3.10.3, PROJ 9.6.0; sf_use_s2() is TRUE
library(maptiles)
# import North Carolina counties
nc_raw <- st_read(system.file("shape/nc.shp", package = "sf"), quiet = TRUE)
# Project to EPSG:3857
nc <- st_transform(nc_raw, "EPSG:3857")
# dowload tiles and compose raster (SpatRaster)
nc_osm <- get_tiles(nc, crop = TRUE)
# display map
plot_tiles(nc_osm)
# add Norh Carolina counties
plot(st_geometry(nc), col = NA, add = TRUE)
# add credit
mtext(text = get_credit("OpenStreetMap"), side = 1, line = -1, adj = .99)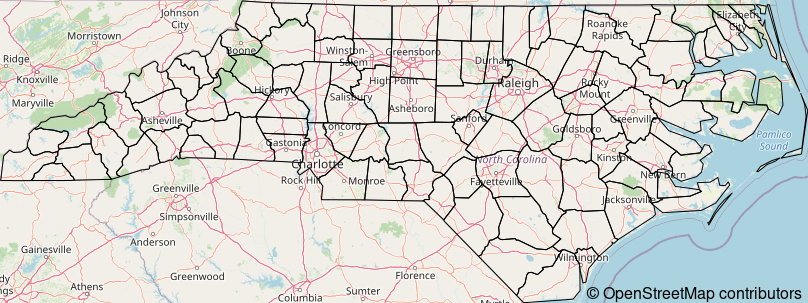
maptiles gives access to a lot of tiles servers, but it
is possible to add others. The following example demonstrates the
setting of a map tiles server and how to cache the original tiles for
future use:
# define the tile server parameters
osmpos <- create_provider(
  name = "CARTO.POSITRON",
  url = "https://{s}.basemaps.cartocdn.com/light_all/{z}/{x}/{y}{r}.png",
  sub = c("a", "b", "c", "d"),
  citation = "© OpenStreetMap contributors © CARTO "
)
# dowload tiles and compose raster (SpatRaster)
nc_osmpos <- get_tiles(
  x = nc, provider = osmpos, crop = TRUE,
  cachedir = tempdir(), verbose = TRUE, retina = TRUE
)
#> Zoom: 7
#> Source(s): © OpenStreetMap contributors © CARTO
#> Cache directory: /tmp/RtmpLSQP7d/CARTO.POSITRON
#> 8 tiles
#> The resulting raster uses high resolution tiles.
# display map
plot_tiles(nc_osmpos)
# display credits
mtext(text = get_credit(osmpos), side = 1, line = -1, adj = .99)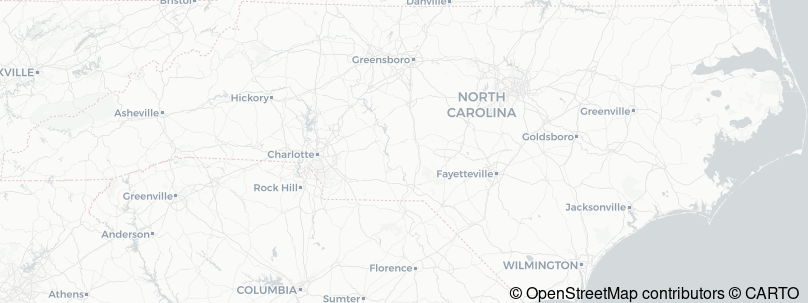
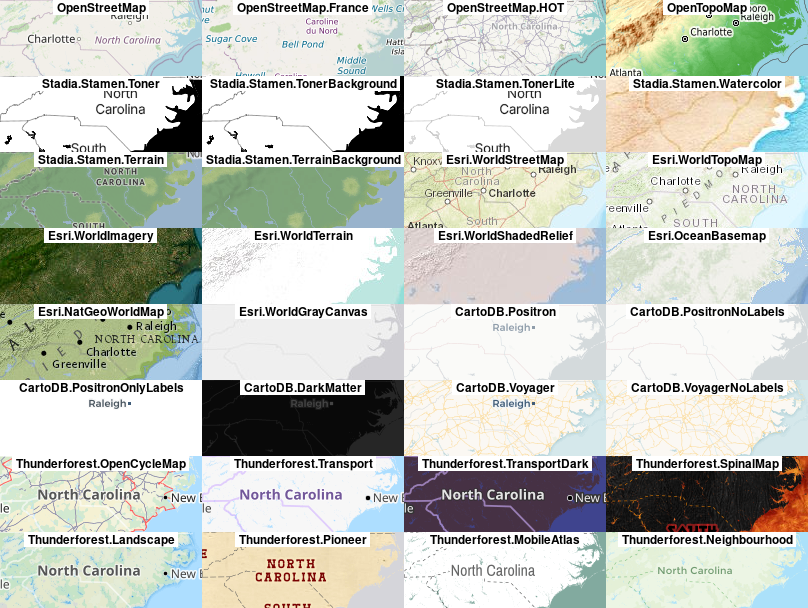
The following figure shows mini maps for most of the tiles providers available:
Original tiles use a projection known as “Web Mercator”, “WGS84 /
Pseudo Mercator”, “Google Mercator”, “EPSG:3857” or “EPSG:900913”. In
most cases get_tiles() uses the projection of its
x argument to reproject the tiles. If you wish to avoid any
deformation induced by the reprojection process, use “EPSG:3857” for
x projection.
All maps available through maptiles are offered freely
by various providers. The only counterpart from the user is to properly
display an attribution text on the maps. get_credit()
displays a short attribution text to add on each map using the
downloaded tiles.
There are many alternative packages that pursue the same objective as
maptiles. Some focus on a specific map tiles provider
(e.g. Mapbox, Google, OpenStreetMap) or on a specific graphics device
(ggplot2). The goal of maptiles is to be
flexible enough to allow the use of different providers and to have a
minimal number of robust and modern dependencies. However, depending on
the use case, one of following packages may better suit your needs:
ceramicggmap
(ggplot2 focused)ggspatial
(ggplot2 focused, based on rosm)mapboxapi
(mapbox)mapsapi
(google, based on RgoogleMaps)OpenStreetMap
(requires Java)RgoogleMaps
(google)rosmNot to be confused with tilemaps,
that “implements an algorithm for generating maps, known as tile maps,
in which each region is represented by a single tile of the same shape
and size.”