![]()
![]()
This package allows users of MaxQuant (from .txt files) and OpenMS (from mzTab files) to generate quality control reports in Html/PDF format.
latest Release: v1.1.1 - Mar 2024
latest Release on CRAN:
same
See NEWS file for a version history.
Please cite PTXQC when using it to check data in your publications:
Proteomics Quality Control: Quality Control Software for MaxQuant Results Chris Bielow, Guido Mastrobuoni, and Stefan Kempa J. Proteome Res., 2016, 15 (3), pp 777-787. DOI: 10.1021/acs.jproteome.5b00780
drag'n'drop your
txt output folder onto a batch file)
A short overview video on PTX-QC] can be found here. If you want to jump to certain sections:
We use pgkdown to create a
HTML documentation, which includes the Vignettes, our function
documentation etc. You can create the documentation locally:
pkgdown::build_site() or visit the online-version on Github
at ./docs/index.html.
If you do not know where to start, look at the package vignettes first.
Our Vignettes give details on:
The ‘List of Metrics’ vignette contains a full description for each metric (the same as seen in the Help section of each Html report).
Within R, you can browse the vignettes using either of these commands (after the package is installed (see below)):
    help(package="PTXQC")
    browseVignettes(package = 'PTXQC')
Of course, you can also look at the Vignettes on CRAN: latest online vignette at CRAN
You can use PTX-QC without installing it, by using our webserver: Visit http://ptxqc.bsc.fu-berlin.de and simply upload your data. This service is not suited for large-scale data analysis, but should be fine for the occasional analysis.
If you want to generate QC reports without actually getting involved in R:
We offer a Batch-file based Drag’n’drop mechanism to trigger PTXQC on any MaxQuant output folder. This only works for Windows (not Linux or MacOS) at the moment – but you have a Windows anyway to run MaxQuant, right?! See drag’n’drop for details. It takes 10 minutes and you are done!
If you just want to use PTXQC (and maybe even modify) it:
First, install pandoc (see bottom of linked page). Pandoc is required in order to locally build the package vignettes (documentation), but you can also read the vignettes online from the PTXQC GitHub page. More importantly, Pandoc enables PTXQC to write QC reports in HTML format (which come with a help text for each plot and are interactive). PDF reports only contain plots! The reports are printed as PDF by default and additionally as HTML if Pandoc is found. If you install Pandoc later while your R session is already open, you need to close and re-open R in order to make R aware of Pandoc!
You can grab PTXQC from either CRAN or GitHub. GitHub installation will give you the latest package; the CRAN version might be a little older, but is faster to install. Check the NEWS file for CRAN submissions and version. > For the code blocks below: Run each line separately in your R console, i.e. do not copy and paste the whole block. > If an error should occur, this allows to track it down more easily. See FAQ - Installation > how to resolve them.
## CRAN
install.packages("PTXQC")
or
## GitHub
if (!require(devtools, quietly = TRUE)) install.packages("devtools")
library("devtools")             ## this might give a warning like 'WARNING: Rtools is required ...'. Ignore it.

## use build_vignettes = FALSE if you did not install pandoc or if you encounter errors when building vignettes (e.g. PRIDE ftp unavailable)!
install_github("cbielow/PTXQC", build_vignettes = TRUE, dependencies = TRUE)
To get started, see the help and/or vignettes:
help(package="PTXQC")
browseVignettes(package = 'PTXQC')
Please feel free to report bugs (see below), or issue pull requests!
An overview chart at the beginning of the report will give you a
first impression.
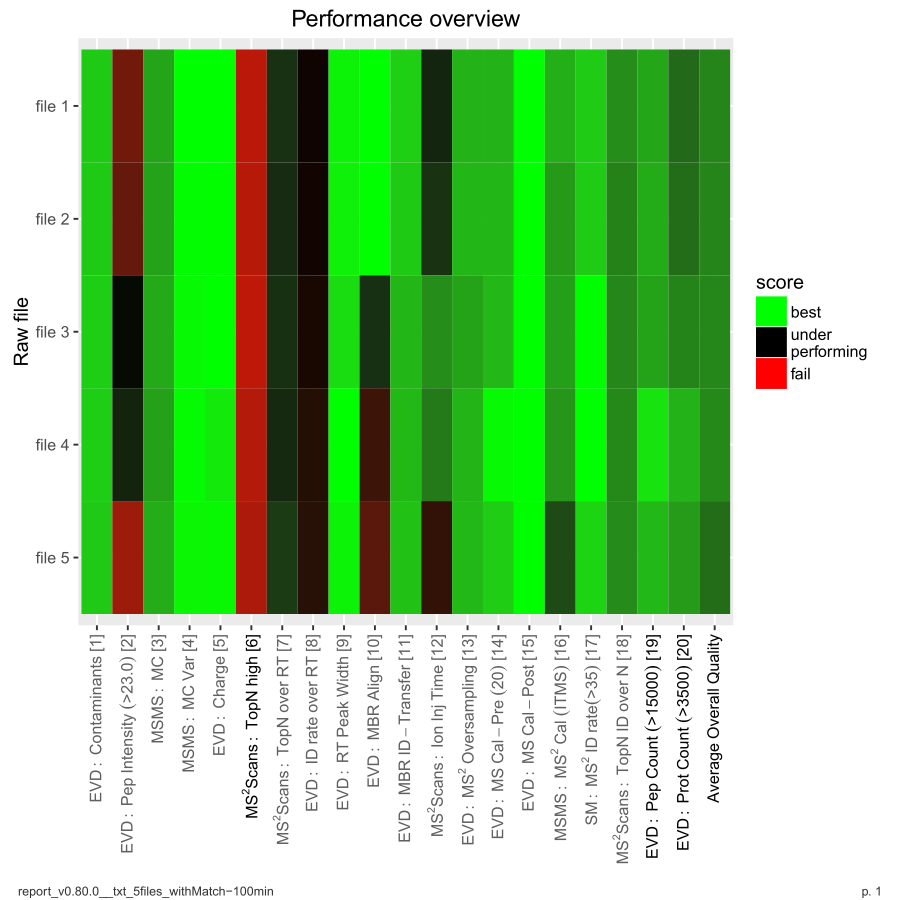
Detailed plots can be found in the remainder of each report.
For example input data and full reports, see the ‘inst/examples’ subfolder.
If you encounter a bug, e.g. error message, wrong figures, missing axis annotation or anything which looks suspicious, please use the GitHub issue tracker and file a report.
You should include - stage you encounter the bug,
e.g. during installation, report creation, or after report creation
(i.e. a bug in the report itself). - PDF/Html report
itself (if one was generated). - version of PTXQC,
e.g. see the report_XXX.pdf/html (where XXX will be the version) or see
the DESCRIPTION file of the PTXQC package or call
help(package="PTXQC") within R - error
message (very important!). Either copy it or provide a screen
shot.
Please be as precise as possible when providing the bug report - just imagine what kind of information you would like to have in order to track down the issue. In certain situations, the whole txt-folder or a single MaxQuant/mzTab file might be helpful to solve the problem.
We welcome input from our user base! PTX-QC has a very permissive BSD-3 clause License (see DESCRIPTION file), so feel free to fork, patch and contribute! There are many ways to get involved, you do not need to be a developer! - suggest a new metric (and why you think it’s useful) by opening a new ticket here on GitHub. - suggest changes to existing metrics (improvements or bugfixes), see above. - suggest improvements to our documentation (e.g. additional vignettes) - write code (in R) and submit a Pull Request (PR).
Come and interact with developers and users at https://discord.gg/MB6PvpctUY
Use PTXQC
v0.69.3 if you want the version which was used in the paper, i.e.
use install_github(..., ref="v0.69.3") when following the
Installation procedure.
The input data used in the original publication is available in the ‘inst/examples’ subfolder.
We recommend to use the most recent PTXQC for the best user experience.