---
title: Probability plot usage
author:
- name: Jakob Theorell
affiliation:
- Oxford Autoimmune Neurology Group, Nuffield Department of Clinical Neurosciences, University of Oxford, Oxford, United Kingdom
- Department of Clinical Neurosciences, Karolinska Institutet, Stockholm, Sweden
date: "`r Sys.Date()`"
vignette: >
%\VignetteIndexEntry{Using the groupProbPlot plot function for single-cell probability display}
%\VignetteEngine{knitr::rmarkdown}
%\VignetteEncoding{UTF-8}
output:
BiocStyle::html_document:
titlecaps: false
toc_float: true
---
```{r style, echo=FALSE, results='hide', message=FALSE}
library(BiocStyle)
library(knitr)
opts_chunk$set(error=FALSE, message=FALSE, warning=FALSE)
knitr::opts_chunk$set(echo = TRUE)
```
# Introduction
In this document, a typical analysis using the groupProbPlot function is shown.
The indention with this function is to display differences between groups,
tissues, stimulations or similar, with a single-cell resolution. The idea is
that a cell that comes from a cell type that is specific for one of the two
investigated groups will be surrounded exclusively by euclidean nearest
neighbors that come from the same group. This is the basis for the analysis:
in the standard case, the individual cell is given a number between -1 and 1
that reflects which fraction of the 100 closest neighbors in the euclidean space
created by all the input markers that come from one group (-1) or the other (1).
The scale is tweaked to reflect that the middle in this case corresponds to a
likelihood of a perfect mix with 50% of the cells from each group. For an
introduction to the package and example data description, see the general
DepecheR package vinjette.
# Installation
This is how to install the package, if that has not already been done:
```{r, eval = FALSE}
if(!requireNamespace("BiocManager", quietly = TRUE))
install.packages("BiocManager")
BiocManager::install("DepecheR")
```
# Preparations of example data
For visualization purposes, some 2-dimensional representation of the data is
necessary. This could just be two of the variables used to construct the
probability vector, but it is more informative to include data on all variables,
aided by e.g. tSNE or UMAP. In this case, we will display the data with tSNE.
```{r}
library(DepecheR)
data("testData")
data("testDataSNE")
```
# Group probability plotting
This function differs from the other group differentiation functions in the
DepecheR package in that no clustering output from the depeche function or any
other clustering algorithm is needed as input. Instead, all the indata that the
euclidean nearest neighbors should be identified from needs to be added,
together with a group identity vector and the 2D data used to display the data.
Optionally, the resulting group probability vector can be returned, which will
be the case in this example.
```{r, eval = FALSE}
dataTrans <-
testData[, c("SYK", "CD16", "CD57", "EAT.2", "CD8", "NKG2C", "CD2", "CD56")]
testData$groupProb <- groupProbPlot(xYData = testDataSNE$Y,
groupVector = testData$label,
groupName1 = "Group_1",
groupName2 = "Group_2",
dataTrans = dataTrans)
## [1] "Done with k-means"
## [1] "Now the first bit is done, and the iterative part takes off"
## [1] "Clusters 1 to 7 smoothed in 2.9159369468689 . Now, 13 clusters are
## [1] left."
## [1] "Clusters 8 to 14 smoothed in 0.925199031829834 . Now, 6 clusters are
## [1] left."
## [1] "Clusters 15 to 20 smoothed in 0.905373096466064 . Now, 0 clusters are
## [1] left."
```
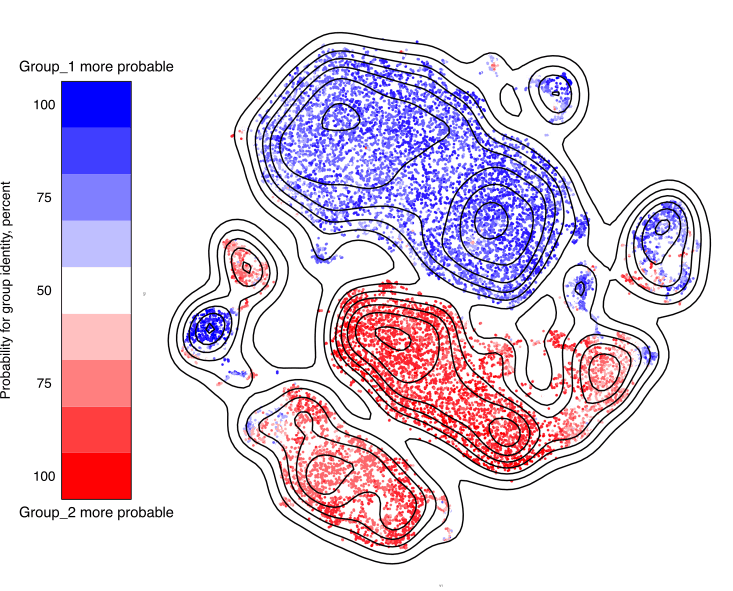
When running this function, the output is a high-resolution plot saved to disc.
A low resolution variant of the result (made small for BioConductor size
constraint reasons) is shown here. In this case, the groups are so separated,
that almost all cells show a 100% probability of belonging to one of the groups
or the other. This is unusual with real data, so the white fields are generally
larger.
# Session information
```{r}
sessionInfo()
```